
In September 2020, UC Berkeley’s Rausser College of Natural Resources selected the Kellylab for a Sponsored Project for Undergraduate Research (SPUR) project for their proposal entitled “Mapping municipal funding for police in California.” The project partnered with Mapping Black California (MBC), the Southern California-based collective that incorporates technology, data, geography, and place-based study to better understand and connect African American communities in California. We met weekly during the fall semester and gathered data from 472 cities across California, detailing the per-capita police funding and percent of municipal budget that is spent on police departments. California has nearly 500 incorporated cities and most municipalities have their own police departments and create an annual budget determining what percentage their police department will receive. The variability in police spending across the state is quite surprising - check out the figures below. The average percentage of municipal budgets spent on policing is about 20%, and while some municipalities spent less than 5% of their budgets on policing, others allocated more than half of their budgets to their police departments. Per capita police spending is on average about $500, but varies largely from about $10 to well over $2,000. If you are interested in this project, explore our findings through the Story Map: examine Southern California and the Bay Area in detail, check out a few interesting cities, or search for a city and click on it to see just how much they spent on policing in 2017.
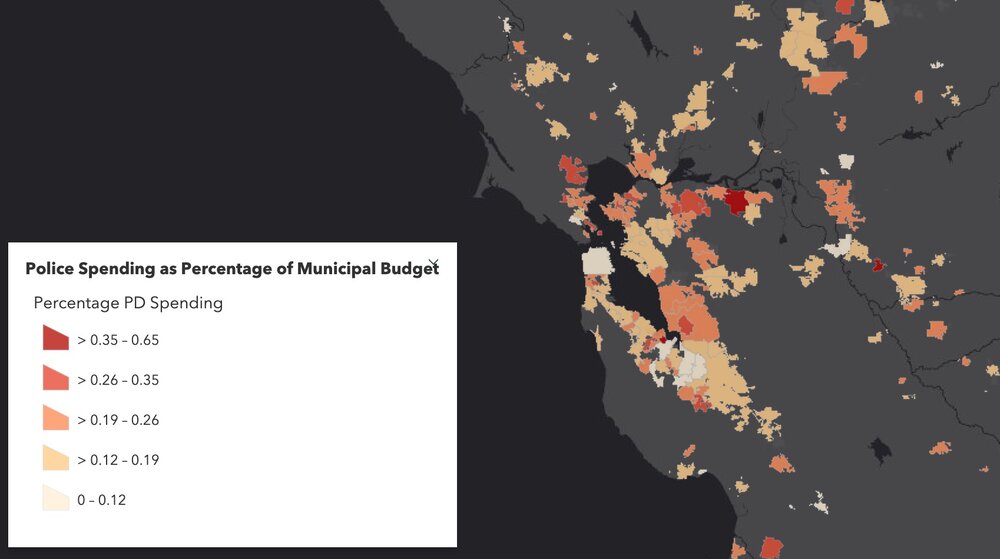
Figure showing variability in Police Spending (% of municipal budget) in Northern California in 2017. Data from California State Controller's Cities Finances Data, 2017 (City and police spending information). For more information see the Story Map here.
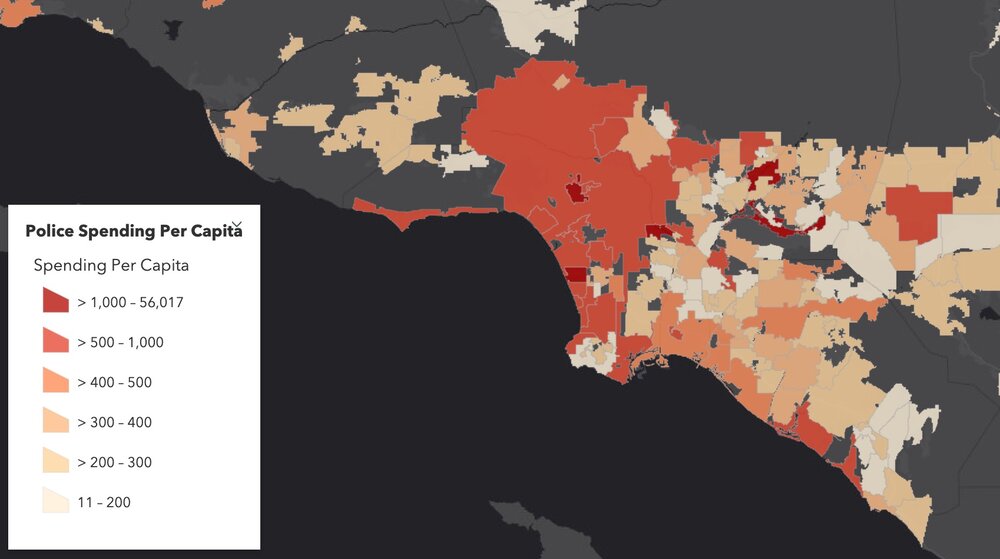
Figure showing variability in Police Spending (PEr capita) in Northern California in 2017. Data from California State Controller's Cities Finances Data, 2017 (City and police spending information). For more information see the Story Map here.
The analyst on the project has been Ben Satzman, a UC Berkeley Conservation and Resource Studies Major with minors in Sustainable Environmental Design and GIS, who worked in collaboration with MBC and the Kellylab to find, clean, visualize, and analyze statewide data. We plan on continuing the project to explore the possible influences (such as racial diversity, crime, poverty, ethnicity, income, and education) underlying these regional trends and patterns in police spending. Personnel involved in the project are: from Mapping Black California - Candice Mays (Partnership Lead), Paulette Brown-Hinds (Director), Stephanie Williams (Exec Editor, Content Lead), and Chuck Bibbs (Maps and Data Lead); from the Kellylab: Maggi Kelly (Professor and CE Specialist), Chippie Kislik (Graduate Student), Christine Wilkinson (Graduate Student), and Annie Taylor (Graduate Student).
We thank the Rausser College of Natural Resources who funded this effort.