
The Magic Behind Cal-Adapt: The API
If you're reading this you've probably heard of Cal-Adapt, California's official source for downscaled climate data from the 4th Climate Change Assessment. Most people have engaged with climate data on Cal-Adapt through the website, which provides over a dozen well-designed interactive tools that allow you to create charts and maps of wide range of climate variables, from temperature to snow pack to wildfire risk, for your location of interest. For the intrepid user, the website also has a download tool where you can download the data as CSV or raster files, or the source files in NetCDF format.
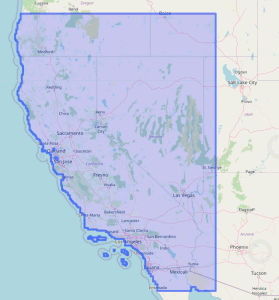
Cal-Adapt provides access to a wealth of downscaled climate data for
California, Nevada, and parts of neighboring states
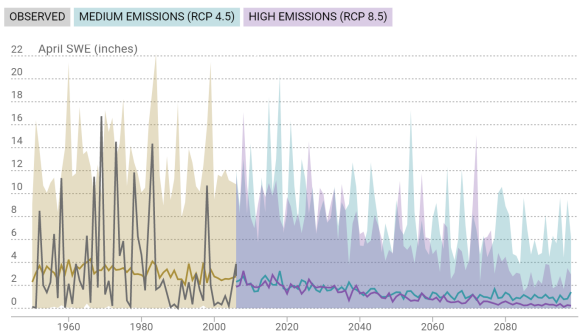
Sample chart from Cal-Adapt.org
A lesser known fact is that all this magic is made possible under the hood by a well-designed open API. An API, or Application Programming Interface, is essentially a common language that allows computer programs to talk to each other. Using the API, the Cal-Adapt website can retrieve data from the Cal-Adapt server, on demand, to make all those beautiful charts and maps.
But guess what? This same API, which is fully open and documented on the Cal-Adapt website, can be used by things other than websites. Any programming language that supports standard web protocols can send specially formatted commands through the API to get climate data directly from Cal-Adapt, without ever having to go through the website. This includes R and Python, the two most popular programming languages for data science, with users in the hundreds of thousands.
Introducing caladaptR

Why is this a big deal, you might ask? We can start with the huge number of R users, particularly in research and academia. The science of climate change impacts and adaptation planning are still young and rapidly evolving, and R is by far the favorite computing environment for researchers. Before caladaptR, a data scientist would need to go through the Cal-Adapt website and download the raw data as rasters or CSV files, one variable at a time, and one zip file at a time. She would then have to import those files into R using the file names as a reminder of which data it contains. This process works, and many people have done, but it's time consuming and klunky. caladaptR replaces all of those manual steps with a few lines of code that can be easily tweaked for new locations, climate variables, and models.
For civilians out there, this is still a big deal because it means adaptation planners and researchers can not only work more efficiently, they can also package up their analyses in user-friendly output formats that R is really good at. This includes markdown reports, as well as tailored decision support tools.
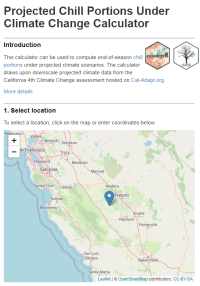 One of R's most popular features is R-Shiny, a package which allows R users to bundle their analyses up into user friendly interactive web sites, or apps. These web apps aren't limited to show pre-canned results, they can actually fetch data "on the fly" and run analyses based on user input. caladaptR is a "Shiny ready" package that includes a widget to show your data download status. A couple of sample Shiny apps are available on the website, including one that computes the projected amount of winter chill in the coming decades, which can help tree crop growers decide which variety of tree nuts to plant, or whether to get out of tree nuts all together.
Not surprisingly, we've recently seen growing interest in climate change impacts, and a growing recognition that data from climate models need to be transformed into measures that make sense to regular folks. Data science platforms like R, that can tap into cloud data and services via APIs, are the kinds of tools that will build the next generation of climate science translation services. With R and caladaptR, analyzing climate impacts and developing decision support tools is well within reach of anyone who has intermediate R skills.
Learning More
For more details, check out the following overview videos. When you're ready to start writing some code, head over to the caladaptR website which has installation instructions, getting started code, sample notebooks, workshop recordings, and long-form articles on some of the more advanced features. You can also attend an upcoming workshop (the next caladaptR workshop will be February 2022) and sign-up for IGIS Office Hours if you have any questions.