Calculate NDVI from Recent Sentinel Satellite Imagery in Google Earth Engine
IGIS Tech Notes describe workflows and techniques for using geospatial science and technologies in research and extension. They are works in progress, and we welcome feedback and comments below.
by Annie Taylor
Summary
Google Earth Engine (EE) is a cloud/browser-based platform for planetary scale geospatial analysis that relies on Google's processing and storage capabilities to enable large analyses in very little time. Earth Engine is home to hundreds of public remote sensing/geospatial datasets totaling more than thirty petabytes, and is continuously updated as images are captured. Here, we take advantage of the up-to-date and easy-to-access satellite imagery in Earth Engine to calculate and display a vegetation index (NDVI) from recent Sentinel imagery, anywhere on earth. This Tech Note reviews the code necessary to do this in Earth Engine based on requests to leverage this tool for agricultural applications.
Need some help getting started? View the recording of our Introduction to Earth Engine workshop (July 2020).
Get started in Earth Engine (new users)
- Register for an Earth Engine account at https://earthengine.google.com/signup/ with a Gmail account.
- Once you’re an approved user (can take a day or two), go to the Earth Engine Interface at https://code.earthengine.google.com/ to get started.
- If you’re completely new to Earth Engine, you may want to check out the Earth Engine Get Started guide or the API Tutorials. You can also watch a recording of our Introduction to Earth Engine Workshop.
Import Sentinel-2 Imagery within your study area
Note: if you choose to copy and paste these lines of code into the EE Code Editor, you may need to re-type the quote marks, as these may not paste correctly.
- Import all available Sentinel 2 surface reflectance imagery as an ee.ImageCollection:
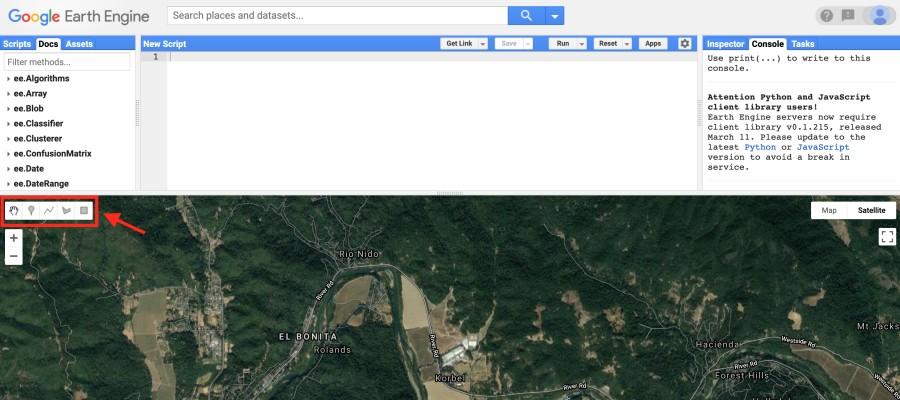
- Using the drawing tools in the top left of the map, draw a point or rectangle representing your study area. Press ‘Exit’ when you have finished your drawing, or select a shape and press ‘delete’ to remove it. This shape will automatically be called ‘geometry.’


- Modify your first line to filter the image collection just to your study area.
- Center your map at your study area.
- Optional: if you’d like to filter for images captured between two dates, use the filterDate() function shown below, with dates formatted as ‘yyyy-mm-dd’.
Calculate NDVI from the Sentinel-2 imagery
- Create a function that adds an NDVI band to a Sentinel-2 image. NDVI is calculated as the normalized difference between the near-infrared band and the red band, which correspond to the 8th and 4th band in the Sentinel-2 imagery.
- Apply this function across your image collection using the ‘map’ function to add NDVI as a band to each image and save it as a new image collection.
Select the Most Recent Image
- Sort the image collection by date and select the most recent image to save it as a new variable.
- Print the image’s metadata to the console to view its metadata, including the date it was captured.
Add the Most Recent NDVI Image to the Map
- Create a variable with the NDVI color scheme/palette.
- Select just the NDVI band and add the NDVI image to the map using the NDVI color scheme. Name the layer ‘Recent NDVI’ for the map legend.
- Hit the ‘Run’ button to see the resulting NDVI image displayed on the Map, and to view the image metadata that is now printed to the Console (right side of the screen). To see the map more clearly, check off the shape you drew by hovering over the Geometry Imports bar and unchecking the box next to ‘geometry.’

You’re done! Here are a few potential next steps:
- Check out a copy of the final code in Earth Engine to check your work.
- Explore the NDVI value at a given point by selecting the Inspector tool (upper right) and clicking at any point on the image.
- Calculate the average, minimum, or maximum NDVI value across your study area with the Reduce Regions function.
- Explore how to filter out cloudy pixels in Sentinel imagery, if this is a common issue in your study area.
- Export the raster as a GeoTIFF to analyze it in other geospatial software programs.
- Calculate a multi-day NDVI median composite image using the ten most recent images. This optional code is also included in the EE script.
More Resources
- Check out Earth Engine’s full Data Catalog to see other datasets that are available.
- As mentioned above, the Earth Engine Get Started guide and API Tutorials are a great resource.
- Work through a Earth Engine Beginning Workshop or Intermediate Workshop .
- Reference the Earth Engine Guides when you get stuck (these include comprehensive API Documentation to search for help with specific functions).
- Join the Developers Group where EE users post and answer questions.
This work was supported by the USDA - National Institute of Food and Agriculture (Hatch Project 1015742; Powers).
3 Comments
-
priyanka tiwary
May 26, 2023Hello!! I am working on agricultural project and want to generate NDVI plot wise with NDVI value. Can you please share any code for executing this work. Thank you
-
Yeison Alberto Garcés Gómez
February 21, 2022I have the follow error: S2_SR.map is not a function Could you please help me
-
Gezahagn
December 26, 2021Thanks dear Annie for sharing. I would like to be member of IGIS and to be PhD candidate, if there is an opportunity for research activities. With regards Merry X-mas and happy new year Gezahagn