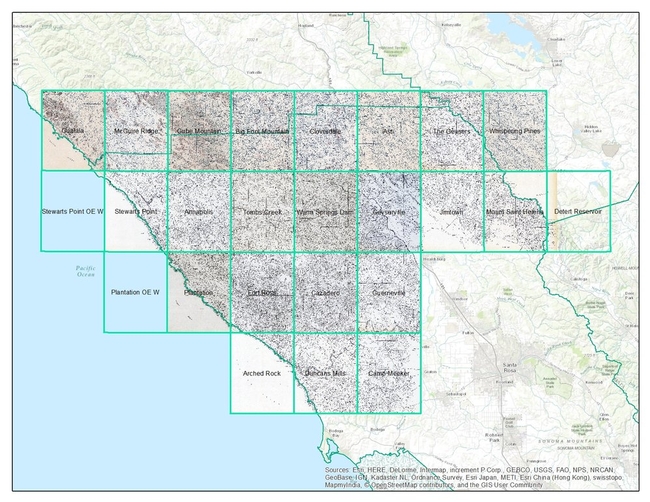
Between the years 1949-1979 the Pacific Southwest research station branch of the U.S. Forest service published two series of maps: 1) The Soil-Vegetation Maps, and 2) Timber Stand Vegetation Maps. These maps to our knowledge have not been digitized, and exist in paper form in university library collections, including the UC Berkeley Koshland BioScience Library.
Index map for the Soil Vegetation MapsThe Soil-Vegetation Maps use blue or black symbols to show the species composition of woody vegetation, series and phases of soil types, and the site-quality class of timber. A separate legend entitled “Legends and Supplemental Information to Accompany Soil-Vegetation Maps of California” allow for the interpretation of these symbols in maps published 1963 or earlier. Maps released following 1963 are usually accompanied by a report including legends, or a set of “Tables”. These maps are published on USGS quadrangles at two scales 1:31,680 and 1:24,000. Each 1:24,000 sheet represents about 36,000 acres.
The Timber Stand Vegetation Maps use blue or black symbols to show broad vegetation types and the density of woody vegetation, age-size, structure, and density of conifer timber stands and other information about the land and vegetation resources is captured. The accompanying “Legends and Supplemental Information to Accompany Timber Stand-Vegetation Cover Maps of California” allows for interpretation of those symbols. Unlike the Soil-Vegetation Maps a single issue of the legend is sufficient for interpretation.
We found 22 quad sheets for Sonoma County in the Koshland BioScience Library at UC Berkeley, and embarked upon a test digitization project.
Scanning. Using a large format scanner at UC Berkeley’s Earth Science and Map library we scanned each original quad at a standard 300dpi resolution. The staff at the Earth Science Library completes the scans and provides an online portal with which to download.
Georeferencing. Georeferencing of the maps was done in ArcGIS Desktop using the georeferencing toolbar. For the Sonoma county quads which are at a standard 1:24,000 scale we were able to employ the use of the USGS 24k quad index file for corner reference points to manually georeference each quad.
Error estimation. The georeferencing process of historical datasets produces error. We capture the error created through this process through the root mean squared error (RMSE). The min value from these 22 quads is 4.9, the max value is 15.6 and the mean is 9.9. This information must be captured before the image is registered. See Table 1 below for individual RMSE scores for all 22 quads.
Conclusions. Super fun exercise, and we look forward to hearing about how these maps are used. Personally, I love working with old maps, and bringing them into modern data analysis. Just checking out the old and the new can show change, as in this snap from what is now Lake Sonoma, but was the Sonoma River in the 1930s.

Thanks Kelly and Shane for your work on this!